Short answer
A Zoho Analytics dashboard for sales is built by syncing Zoho CRM data into Zoho Analytics through its CRM connector, creating reports for each question you want answered, and arranging them with KPI widgets and filters on a shared dashboard. It goes beyond built-in Zoho CRM reports by letting you blend CRM data with finance, support or marketing data and apply more advanced calculations.
Key takeaways
- Zoho CRM’s own dashboards are fine for day-to-day views; Zoho Analytics adds blending, deeper calculations and wider sharing.
- An administrator sets up the Zoho CRM connector; sync frequency depends on your Zoho Analytics plan.
- Prebuilt reports and dashboards give you a head start after the first sync.
- Design the dashboard from the questions leaders ask, not from the data available.
- Poor CRM data produces confident-looking but wrong dashboards, so fix data quality first.
Most sales teams on Zoho CRM start with the built-in reports and dashboards, and for many that is enough. The need for Zoho Analytics usually appears when leadership asks questions that span systems: which lead sources produce profitable customers, how pipeline compares with invoiced revenue, or how support volume affects renewals. This guide shows how to build a sales dashboard in Zoho Analytics from Zoho CRM data, and how to make it one people trust.
Zoho CRM reports or a Zoho Analytics dashboard?
Start by deciding whether you need Zoho Analytics at all.
| Need | CRM reports and dashboards | Zoho Analytics |
|---|---|---|
| Day-to-day pipeline and activity views | Well suited | Also possible |
| Combining CRM data with accounting, support or marketing data | Limited | Designed for it |
| Complex calculated measures and query tables | Limited | Supported |
| Sharing with people who do not use the CRM | Requires CRM access | Share or embed dashboards |
| Historical trend analysis at scale | Basic | Strong |
If most of your questions sit in the first row, improve your CRM reporting first; our Zoho CRM reports guide covers what is possible. If you need the other rows, Zoho Analytics is the right tool. Note that Zoho CRM Ultimate includes advanced BI bundled with Zoho Analytics, which is covered in our Zoho CRM editions comparison.
How to connect Zoho CRM to Zoho Analytics
Zoho Analytics has a dedicated connector for Zoho CRM. According to Zoho’s connector documentation, a user with administrative privileges sets it up, either from Zoho CRM or from Zoho Analytics.
- Choose the modules to sync. Standard modules such as Leads, Contacts, Accounts, Deals, Tasks, Meetings, Calls, Products, Quotes, Sales Orders, Invoices and Campaigns are available.
- Select fields. Mandatory fields are preselected; add the custom fields your reports need.
- Set the sync schedule. The options available depend on your Zoho Analytics plan, with more frequent syncs, and real-time sync, on higher plans.
- Review the prebuilt content. Zoho creates a set of ready-made reports and dashboards after the first import, which you can use as they are or adapt.
Because the CRM data arrives as related tables, relationships such as deals to accounts are available for reporting straight away.
Designing a sales dashboard that people use
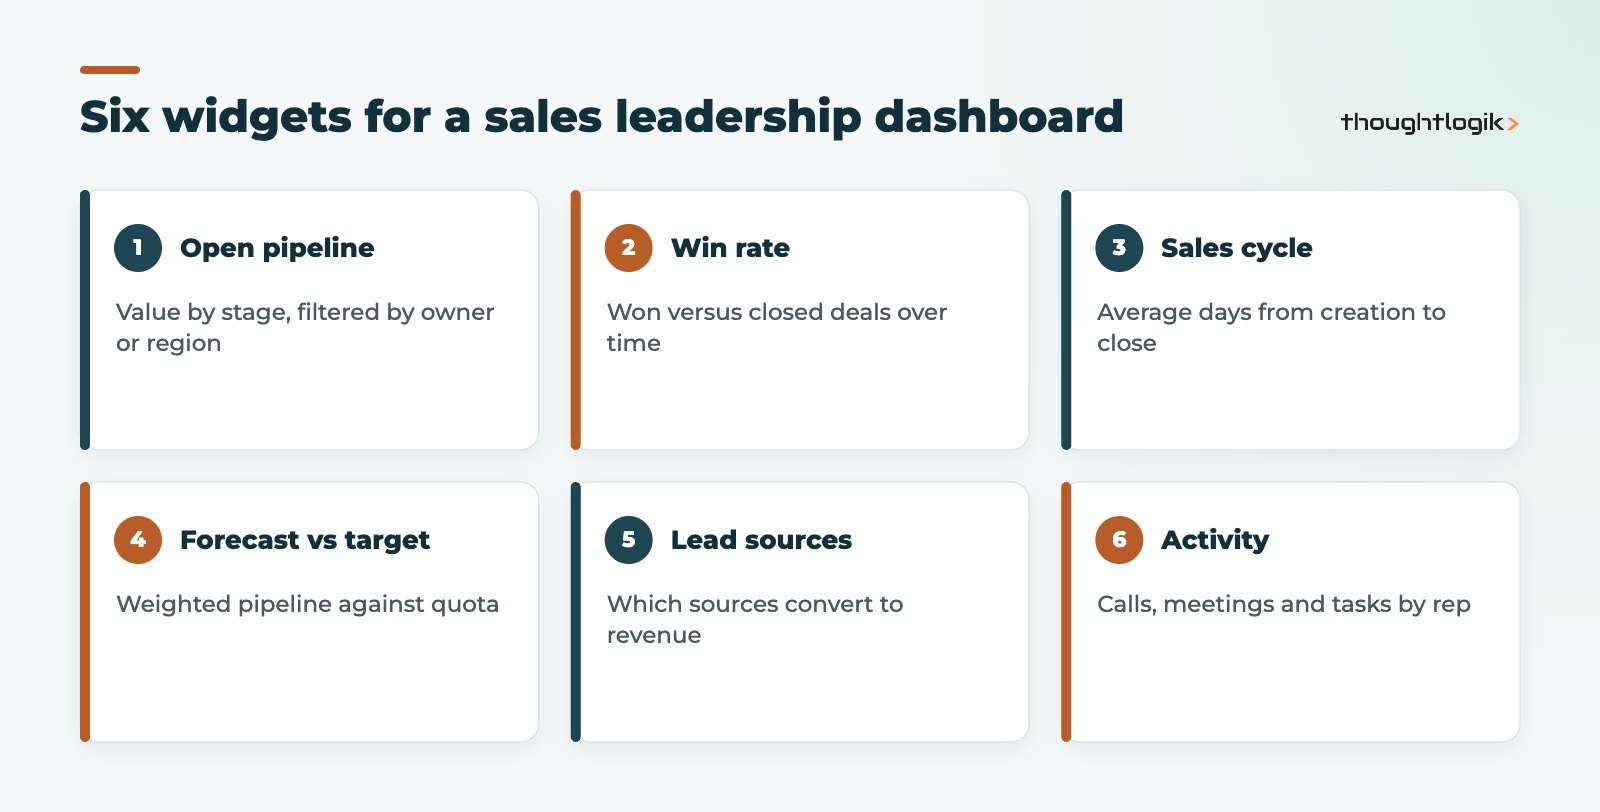
The most common mistake is building a Zoho Analytics dashboard around the data rather than the decisions. Start by listing the five to eight questions your sales leadership asks every week, then build one report per question. Agree how each of the sales KPIs is defined before you build, so the dashboard settles arguments rather than starting them.
Which sales KPIs belong on a Zoho Analytics dashboard?
- Open pipeline by stage: the backbone of pipeline reporting, filterable by owner, region or product.
- Win rate: won deals as a share of closed deals, tracked over time.
- Average deal size and sales cycle length: early warnings when deals are stalling.
- Forecast against target: weighted pipeline compared with quota.
- Lead source performance: which sources turn into revenue, not just leads.
- Activity levels: useful context, but keep it secondary to outcomes.
Layout and interactivity
Put headline KPI widgets across the top, trend charts in the middle and detail tables at the bottom. Add dashboard filters for date range, owner and region so one dashboard serves several audiences. Keep colours consistent: the same stage should be the same colour on every chart.
Test the draft with two or three of the people who will use it. Ask them what decision they would make from each widget. If nobody can answer for a particular chart, remove it; a shorter dashboard that gets opened every Monday is worth more than a comprehensive one nobody reads.
Blending CRM data with finance and support data
This is where Zoho Analytics pays off. You can bring in data from other Zoho apps, such as Zoho Books, Zoho Desk and Zoho Campaigns, where Zoho sets up lookups to CRM data automatically, and from third-party sources where you define the relationships yourself using a common column.
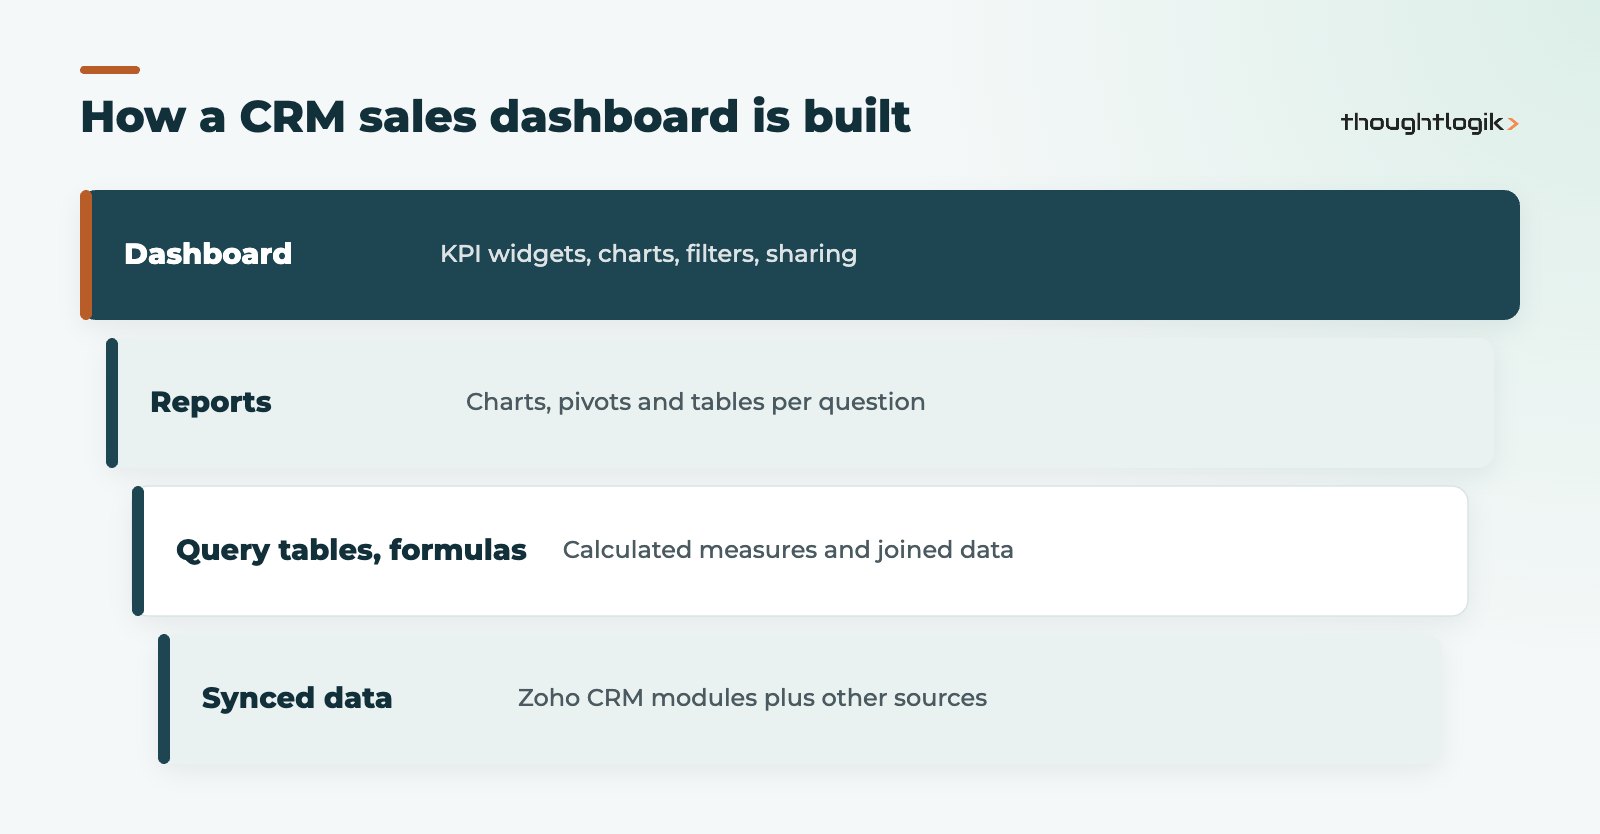
Typical blended views include pipeline alongside invoiced revenue, customer profitability by lead source, and open support tickets for accounts with renewals due. Use query tables to build these joins once and reuse them across reports.
Blending also improves pipeline reporting. Comparing what the CRM says will close with what was actually invoiced shows whether your stage probabilities are realistic, and it is often the first time sales and finance look at the same numbers. Start with one blended view, get agreement that it is right, then add more. A Zoho Analytics dashboard that mixes too many sources at once is hard to validate, and one wrong figure can undermine trust in the whole thing.
Sharing and governance for your Zoho Analytics dashboard
- Share dashboards with specific users or groups, and apply filters so people see only their own region or team where appropriate.
- Schedule email delivery of key dashboards before weekly sales meetings.
- Name reports clearly and keep a short definitions note for every KPI, so “pipeline” means the same thing to everyone.
- Review unused reports each quarter and remove them.
- Give one person ownership of the Zoho Analytics dashboard, so change requests go through a single route.
Why does my Zoho Analytics dashboard show the wrong numbers?
Usually because of CRM data, not the dashboard. Deals without close dates, stages not updated, duplicate accounts and inconsistent picklist values all flow straight into your charts. Fix the process in Zoho CRM with validation and required fields, and clean duplicates (see our guide to Zoho CRM duplicate records) before you trust the output. Also check sync timing: if the dashboard syncs daily, today’s changes will not appear until the next sync.
How ThoughtLogik helps
We build Zoho Analytics dashboards for UK sales and leadership teams, starting with the questions you need answered and the CRM data quality behind them.
- KPI workshops to define measures before building
- Zoho CRM connector setup, data modelling and blended data sources
- Sales, finance and service dashboards with sharing and scheduling
- Wider BI and reporting services when you need more than one platform
Frequently asked questions
Do I need Zoho Analytics if I have Zoho CRM?
Not always. Zoho CRM reports and dashboards cover many day-to-day needs. Zoho Analytics becomes worthwhile when you need to blend data sources, run complex calculations or share dashboards widely.
How often does Zoho CRM data sync to Zoho Analytics?
It depends on your Zoho Analytics plan. Options range from daily syncs to more frequent schedules, with real-time sync available on higher plans.
Can I build a Zoho Analytics dashboard with data from non-Zoho tools?
Zoho Analytics supports many third-party connectors and file imports. You then relate that data to CRM data using a common column, such as a customer reference.
Can people without a Zoho CRM licence see the sales dashboard?
Dashboards are shared through Zoho Analytics, so viewers need access there rather than a CRM licence. Check how your Analytics plan counts users.
Does Zoho CRM Ultimate include Zoho Analytics?
Yes. Zoho positions Ultimate with advanced BI bundled with Zoho Analytics.
Want a sales dashboard your leadership trusts? We can design it around your KPIs and data. Book a free consultation or see our Zoho CRM UK services.