Short answer
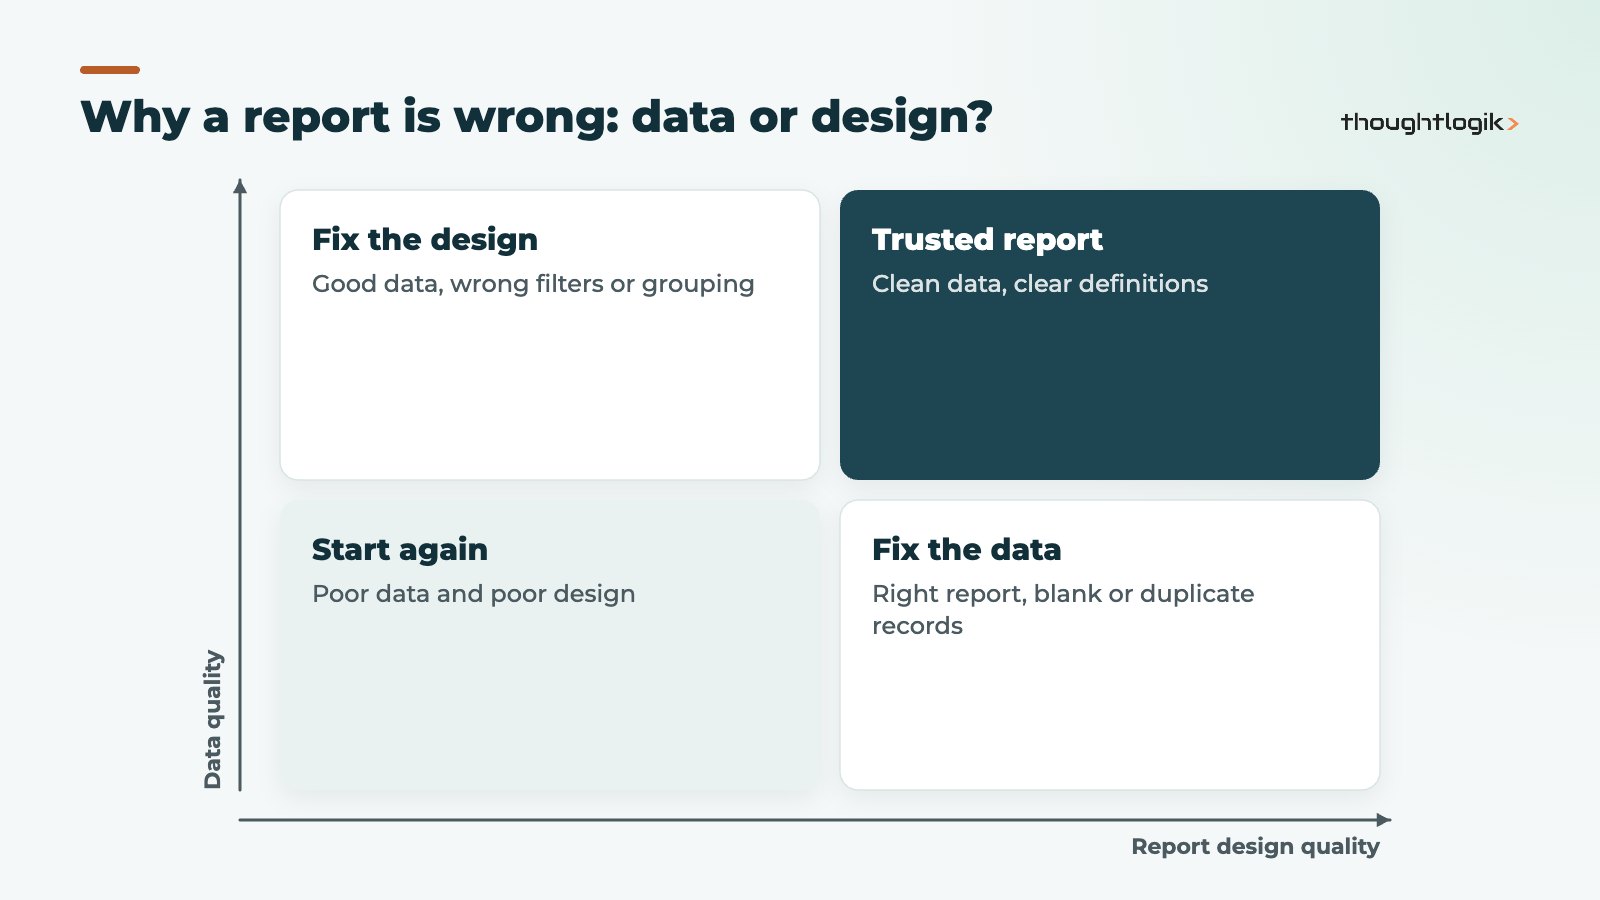
Zoho CRM reports are usually wrong for one of three reasons: the wrong report type or filters, related modules that add or remove rows, or data that is blank, duplicated or out of date. Zoho CRM offers tabular, summary, matrix and joined reports, each suited to a different question. Agree the definition of each number first, then build the report to match it and fix the data it depends on.
Key takeaways
- Choose the report type from the question: list, grouped totals, a grid, or a combined view.
- Most disputes are about definitions, such as which date field counts as “this month”.
- Adding a child module can filter out records that have no related record.
- Users see the records they have access to in the primary module, so the same report can show different totals to different people.
- Reports inherit every problem in your data; blank fields and duplicates show up as wrong totals.
The sales director says pipeline is up. Finance says it is down. Both are looking at Zoho CRM. This is one of the most common problems we are asked to fix, and it is rarely a software fault. Zoho CRM reports do exactly what they are built to do. The problem is that different people built them to answer slightly different questions, often on data nobody has cleaned. This guide explains the report types, how to build them accurately and the mistakes that cause mistrust.
What report types does Zoho CRM offer?
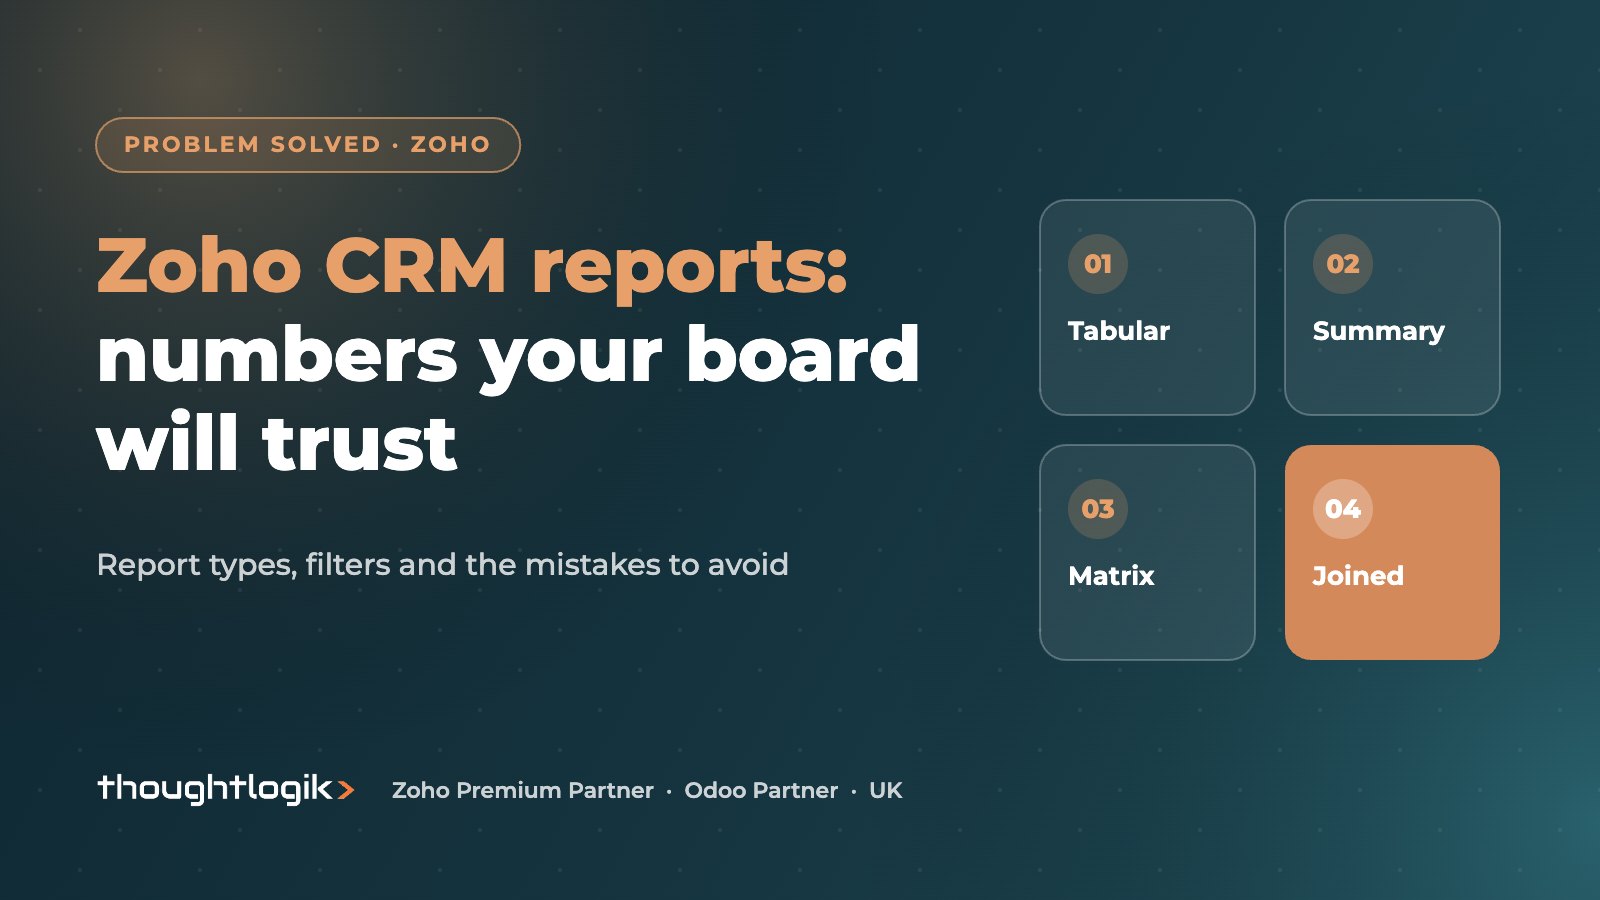
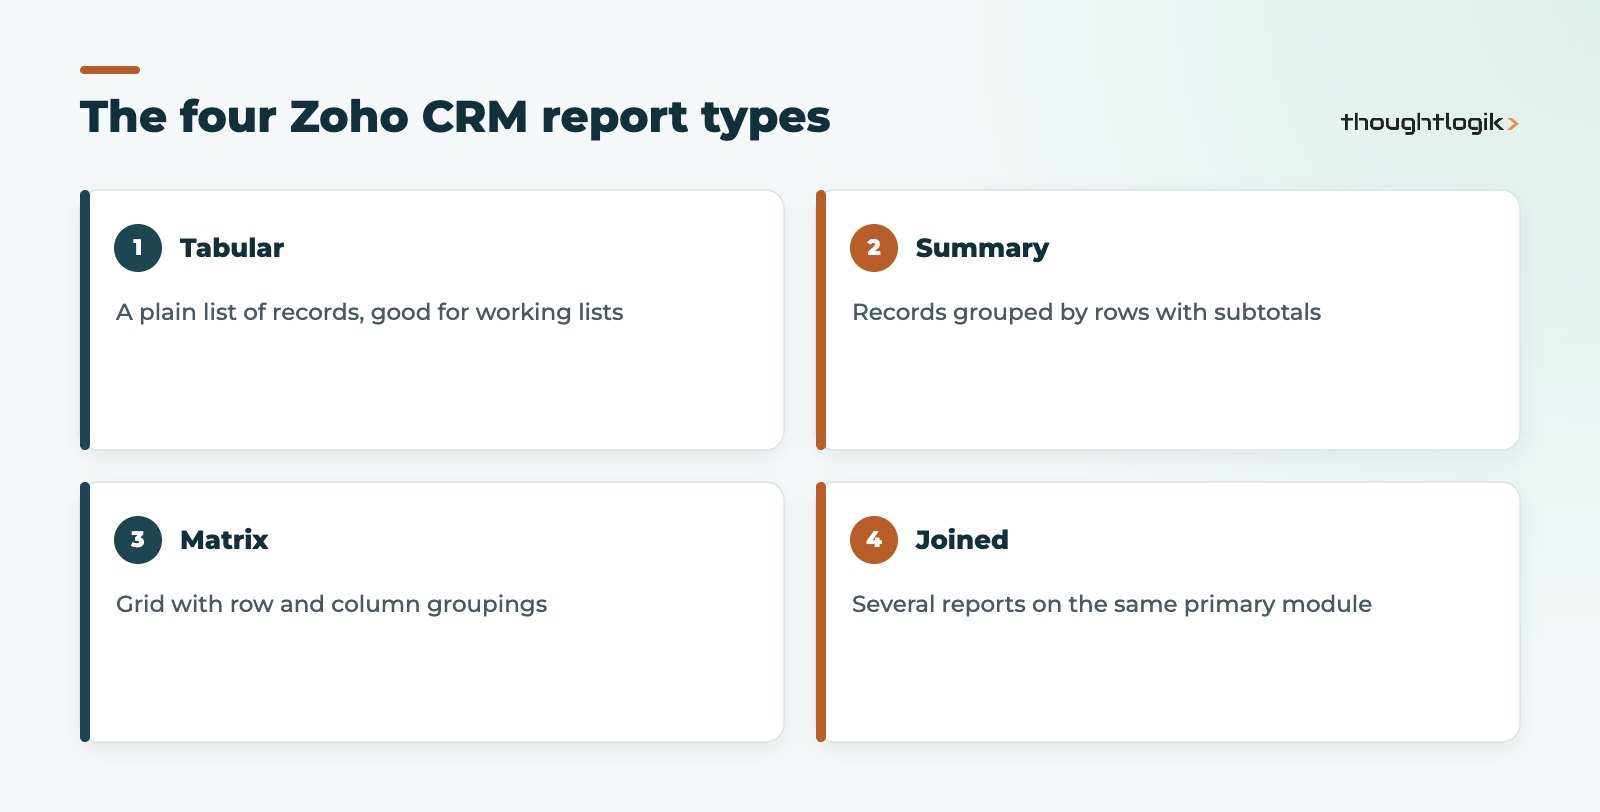
Zoho CRM has four report types. Picking the right one is the first step to a report people understand.
Tabular report
A tabular report is a straight list of records with the columns you choose. Use it for working lists, such as open deals closing this month, or for exports. It does not group or subtotal.
Summary report
A summary report groups records by one or more fields and calculates aggregates such as sum, average, maximum, minimum and record count. Pipeline value by stage, or leads by source, are classic summary reports. You can show or hide detail rows, subtotals and grand totals.
Matrix report
A matrix report is a grid with groupings on both rows and columns, such as deal value by owner (rows) and closing month (columns). It is the best choice when you are comparing two dimensions at once.
Joined report
A joined report combines several reports that share the same primary module, so you can view related datasets side by side in one place.
Zoho’s guide to understanding and building reports covers each report type in more depth.
How to build Zoho CRM reports that add up
1. Write the definition first
Before opening the report builder, write one sentence per number. For example: “Pipeline is the sum of Amount on open deals, excluding Closed Won and Closed Lost, with a Closing Date in the current quarter.” If sales and finance agree that sentence, the report will not be disputed.
2. Pick the primary module carefully
Every report starts from a primary module. You can add parent modules (those referenced by lookup fields on the primary module, such as the account on a deal) and child modules (those shown in related lists). Choose the module whose records you are counting as the primary.
3. Understand how related modules change rows
Adding modules changes what the report returns. When you add a child module, Zoho lets you choose how the relationship works. With an exclusive relationship, only primary records that have a related child record appear: for example, only deals that have associated tasks. That can quietly remove deals from a pipeline report. Check the relationship setting whenever totals look low.
4. Set report filters deliberately
Report filters decide which records count. Use standard date filters on the right date field, and advanced filters for criteria such as stage or owner. After running a report you can apply quick filters to explore the data without changing the saved definition.
5. Group and summarise
For a summary report or matrix report, pick groupings that match the question, then add aggregate columns. Keep the number of groupings small; a report with four levels of grouping is hard to read.
Why are my Zoho CRM reports wrong? Common mistakes
| Symptom | Likely cause | Fix |
|---|---|---|
| Totals differ between two people | Each user sees only records they can access in the primary module | Run board reports as a user with full visibility |
| Deals missing from pipeline | Exclusive child module relationship, or a filter on the wrong date | Check related module settings and date filters |
| Large “None” group | Blank values in the grouping field | Make the field mandatory or fix capture |
| Figures look inflated | Duplicate records | Merge duplicates and prevent new ones |
| Numbers change week to week for past months | Filter on a date field that users edit, such as Closing Date | Report on a fixed date or snapshot the figures |
Visibility and permissions
Zoho states that users see all the records accessible to them in the primary module. So a sales rep and the managing director running the same report can see different totals, and both are correct. Zoho also notes that fields from parent and child modules included in a shared report can be visible to users who cannot otherwise access those records, which matters for sensitive data.
Dirty data
No report fixes bad data. Duplicate accounts double-count revenue; stale deals inflate pipeline. Our guide to Zoho CRM duplicate records covers clean-up, and Zoho CRM Blueprint helps enforce mandatory data at each stage.
Too many versions of the same report
Over time, accounts collect copies: “Pipeline”, “Pipeline v2”, “Pipeline (Sarah)”. Each has slightly different filters, and people quote whichever suits them. Store approved reports in shared folders, restricted by user, role or group, and archive the rest. One owner per folder keeps the collection tidy and makes it obvious which version is the official one.
Report types vs dashboards and analytics
Zoho CRM reports suit operational questions inside the CRM. Dashboards turn reports into charts for a quick view. When you need data from several systems, trend history or finance data alongside sales, Zoho Analytics is the better tool; see our guide to Zoho Analytics sales dashboards. Reports can also be scheduled, so key figures land in inboxes without anyone remembering to run them.
Good reporting also feeds other work. Lead scoring, for example, should be tuned against won and lost deals, which is a summary report; see our Zoho CRM lead scoring guide.
How ThoughtLogik helps
ThoughtLogik audits and rebuilds Zoho CRM reports so every team works from the same numbers.
- Workshops to agree metric definitions with sales, finance and leadership.
- Rebuilt report folders, sharing and dashboards.
- Data clean-up and validation rules so reports stay accurate.
- Advanced analysis through our BI and reporting services.
Frequently asked questions
What are the report types in Zoho CRM?
There are four: tabular reports (plain lists), summary reports (grouped with subtotals), matrix reports (grouped on rows and columns) and joined reports (several reports sharing one primary module).
Why do two users see different totals in the same report?
Zoho CRM reports show the records each user can access in the primary module. A manager with wider access will see more records than a rep with access only to their own.
Why are some deals missing from my Zoho CRM reports?
Check filters first, especially date filters on the wrong field. Then check any child modules: an exclusive relationship shows only deals that have a related record, such as a task.
Can I schedule Zoho CRM reports?
Yes. Reports can be scheduled so they are sent out automatically, which is useful for weekly pipeline or monthly sales summaries.
When should I use Zoho Analytics instead of CRM reports?
Use Zoho Analytics when you need data from several systems, long-term trends, snapshots or more advanced visualisation. CRM reports are best for day-to-day operational questions.
Nobody trusts your CRM numbers? We can audit your reports and data and rebuild them properly. Book a free consultation or see our Zoho optimisation service.